Every business has goals, but goals only matter if you can track progress effectively. A KPI dashboard in Excel is the simplest and fastest way to do this in a neatly structured manner.
A KPI — short for Key Performance Indicator — is a number that shows how close you are to hitting a target. For example, if you aim to grow sales by 20%, your KPI might be monthly revenue growth.
→ 20% is the target
→ “Monthly revenue growth” is the goal/description
Together, you have an indicator that guides day-to-day business operations for growing sales.
Spreadsheet remains a go-to for KPI tracking because it’s simple, familiar, and accessible to almost everyone. To save you time, we’ve created an easy-to-use, free KPI Dashboard Excel Template (built in Google Sheets and fully compatible with Excel) that’s ready for download.
What is a KPI Dashboard?
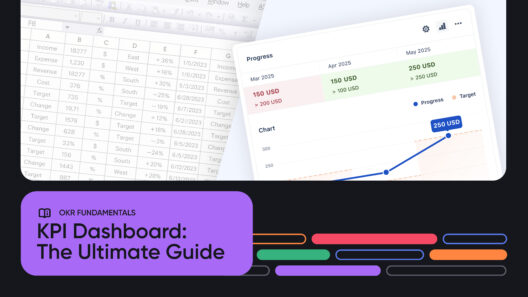
A KPI Dashboard is essentially your business’s mission control panel. Instead of sifting through scattered reports, it pulls your most important numbers — such as sales, customer satisfaction, or finances — into a single, clear view. That way, you can see at a glance whether things are on track or slipping off course.
It’s worth noting the difference between a KPI dashboard and a plain KPI spreadsheet. A spreadsheet is the raw table where you log data, while the dashboard is the visual layer that makes sense of those numbers through color-coded columns and summaries. Both matter, but it’s the dashboard that gives you the quick insights decision-makers rely on. No worries if you’re not a spreadsheet guru; only a few are called, and fewer still are chosen. We’ve built our KPI templates with a low learning curve.
So why do many teams still use a KPI dashboard in Excel? Simple: spreadsheets are cost-effective, highly flexible, and available to almost everyone. They may not be perfect, but they remain the easiest entry point for KPI tracking.
Download Free KPI Excel Templates

To save you the hassle of building from scratch, we’ve created free KPI Excel templates you can start using right away. It’s set up in Google Sheets (and fully compatible with Excel), so you can download it, make a copy, and start plugging in your own numbers within minutes. The setup is simple: open the template you want, replace the sample metrics with your data, and your KPI columns will refresh automatically. No complicated formulas to figure out, no wasted time formatting tables.
Because the design is flexible, you can adapt it for almost any use case, from sales teams tracking pipeline growth to HR teams monitoring employee performance. Think of it as a foundation: a ready-made KPI tracking template that adapts to fit your business, regardless of the industry.
Note: We have created customizable and ready-to-go templates for you:
- Customer Success and Retention KPI template
- Product and Engineering KPI template
- Marketing KPI Template
- Company/Business Performance
Types of KPI Excel Templates
Not every business tracks the exact numbers, which is why KPI dashboards often come in different flavors. There are a lot more dashboard templates, but here are a few of the most common setups:
- General/Company KPI Templates – Perfect for startups and SMEs that need a big-picture view. It’s also suitable for a leadership view, as it provides a more focused lens on what’s important on a company level. A general dashboard might include overall revenue, profit margins, and website traffic in a single view. This is also an excellent dashboard for high-level reporting on the business’s overall health.
- Department-Specific Templates – Tailored dashboards for teams like Marketing, Sales, Customer Success, HR, or Finance. For instance, a marketing KPI dashboard template in Excel could highlight social media engagement, conversion rates, and cost per lead. In contrast, a finance dashboard might focus on operating expenses and cash flow.
- Employee KPI Template Excel – Useful for performance reviews or tracking individual goals. An employee-focused template might display project completion rates, attendance, or customer feedback scores, providing managers with a straightforward way to measure employee contributions.
Whatever the format, the real benefit is flexibility: you can tailor the template to what matters most to your business.
Why KPI Dashboards in Spreadsheets Work, and When They Don’t
There’s a reason so many teams still lean on a KPI template in Excel. It’s low-cost and instantly available. You can spin up a new metric in minutes, drag in data from a report, and share it with a small team without needing extra tools or training.
For anyone just starting, a spreadsheet feels like the natural home for KPIs. But as those KPIs multiply, the cracks begin to show; manual data entry takes longer than you’d like. One broken formula can throw off an entire report. Collaboration becomes messy when several people are editing the same file, and since spreadsheets don’t refresh automatically, you’re always looking at yesterday’s data instead of today’s reality.
That’s why many teams begin in a spreadsheet but eventually move to dedicated tools like Oboard. With Oboard, you still get the clarity of a dashboard, only this time with live updates, automated tracking, and collaboration built in from the start.
From Spreadsheet to Smart Dashboard with Oboard
Spreadsheets are a great way to start tracking KPIs, especially for small teams. You get flexibility, no learning curve (if you’re already familiar with them), and complete control. That’s why we built our free KPI Excel template: to help teams like yours set up dashboards fast without reinventing the wheel.
However, once KPI tracking becomes collaborative or critical to decision-making, it becomes cumbersome and clunky to use. Here’s what Oboard offers as a KPI tracking software.
How Oboard Builds on What You’ve Started in Excel
With Oboard, you’ll create a living system that keeps your KPIs aligned with strategy, updated in real-time, and visible to everyone who needs them. Here’s what sets it apart:
- KPIs that tell a story: Each KPI lives in its own module, complete with status colors (green, amber, red), definitions, owners, and current values. No more guessing what a metric means or who’s responsible for it.
- Progress tracking your way: Use thresholds (e.g., above 95% = on track) or break goals into milestones. Oboard separates setup from updates, keeping your dashboards accurate and easy to manage.
- Historical updates with full context: Backdate KPI changes, add notes, and maintain an audit trail of who updated what, ideal for scheduled business reviews and accountability.
- Modular dashboards: Combine KPIs, OKRs, and context blocks into one customizable view. Filter by team, time period, or progress to see exactly what matters.
- Check-ins that stick: Connect KPI updates to your team’s workflow with reminders via Slack, Microsoft Teams, Discord, or email. Updates happen where your people already are.
- KPIs + OKRs together: Instead of juggling different systems, Oboard brings both into one platform. That means your key metrics are tied directly to the objectives they support.

The jump from a spreadsheet to Oboard feels less like switching tools and more like upgrading your dashboard to better match how your team works. You still get clarity on your KPIs, but now with automated collaboration and strategy built right in. Thinking of jumping in? You can book a free consultation with our experts to see how Oboard integrates into your business operations.